This is a model answer for an Academic Writing Task 1 from the IELTS exam in Sri Lanka, shared recently. This response is likely to get Band 8 or 8.5 in IELTS.
You should spend about 20 minutes on this task
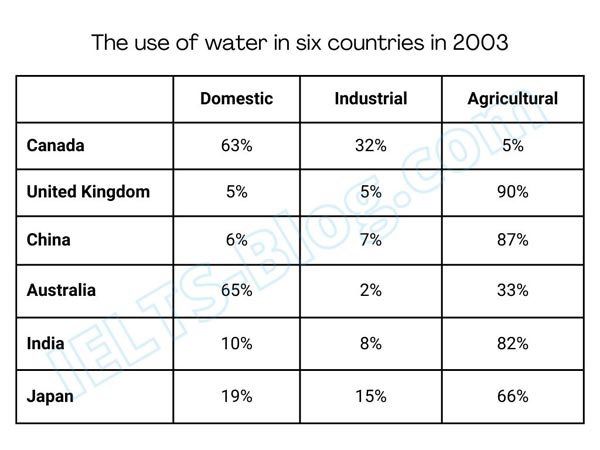
The table below describes water usage for 3 different purposes in 6 countries in 2003. Summarise the information by selecting and reporting the main features, and make comparisons where relevant.
Write at least 150 words
* Note: this isn’t the actual table given in the test, it was recreated for the purpose of demonstration.
Band 8.5 Model Answer
The table illustrates the proportions of water use for 3 different purposes in 6 countries in 2003.
It is clear from the table that most countries used the largest share of water in the agricultural sector and the smallest – in industrial.
To begin, the United Kingdom and China had almost identical water usage profiles and their ratios of agricultural water usage were around 90%, while their domestic and industrial water usage ranged between 5 and 7%. India had slightly different figures, with a lower value for agriculture at 82% and higher figures for domestic and industrial usage at 10 and 8%, respectively.
Canada and Australia had a similar domestic water usage, at 63 and 65%, respectively; however the industry in Canada was a major water consumer at 32%, compared to just 2% in Australia. The Canadian agriculture consumed an insignificant 5% of water, unlike Australia, whose agriculture used 33% of water.
Lastly, Japan use the largest share of its water in agriculture (66%), and the rest was shared between domestic and industrial use, in similar proportions of 19% and 15%, respectively.
Click here to see more IELTS reports of band 8


