This report was written on a topic from “Target Band 7” book (page 43, reprinted with permission).
You should spend about 20 minutes on this task
The diagrams below contain information regarding percentages of people occupied in various types of position in 1998 and 2001.
Write a report for a university tutor describing the information shown.
Write at least 150 words
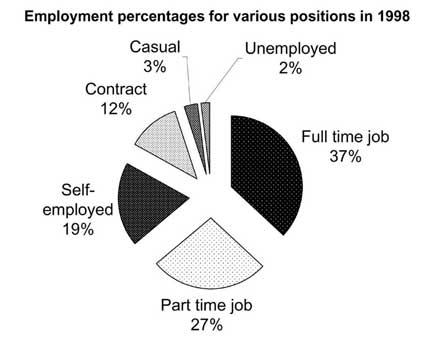
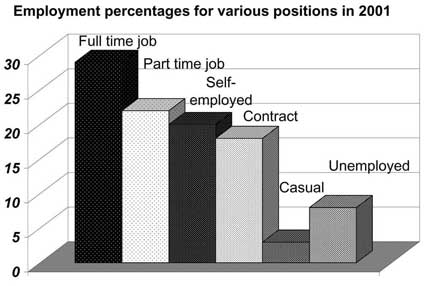
The two charts describe the number of people in various types of employment (casual, unemployed, full time job, part-time job, self-employed and contract) in 1998 and 2001. It is clear that the majority of people held a full time position in both 1998 and 2001.
In 1998 full time workers were the largest group (at 37%), followed by people working part-time jobs (27%), self-employed (19%) and contract workers (12%). Casual labourers and the unemployed made up only 3% and 2% of the workforce, respectively.
In 2001, although full time position holders were still the majority, their proportion dropped to 28% and that of part-time workers – to 20%. The proportion of self-employed remained at 19%, but the number of contract workers’ noticeably increased to 18%. Another significant increase was in the proportion of unemployed, which grew more than threefold to 7% in 2001. Casual workers’ share seemed to stay unchanged at 3%, making them the smallest group in the workforce.
Overall, the charts demonstrate a trend of people leaving full-time employment and the growing unemployment.
Click here to see more IELTS reports of band 8


