This report was written on a topic from “Target Band 7” book (page 42, reprinted with permission).
You should spend about 20 minutes on this task
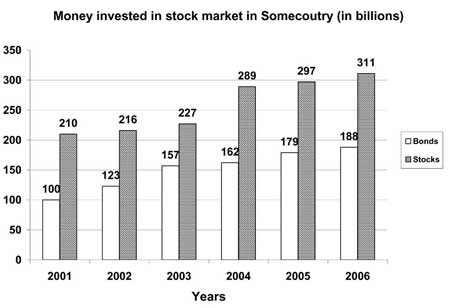
The graph below shows the way people of Somecountry invested their money during the years 2001 – 2006.
Write a report for a university tutor describing the information shown.
Write at least 150 words
The bar graph illustrates the amounts of investment in bonds and stocks in Somecountry from 2001 to 2006. It is noticeable that the money used to buy bonds and stocks showed an upward trend throughout the entire period.
In 2001, stock investments started at 210 billion, which was almost double the amount of bonds, at 100 billion. The stock figures slightly rose by 6 billion in 2002, and in the following year continued to increase to 227 billion. Similarly, the amounts of money that were invested in bonds went up gradually in the two following years to 123 and 157 billion respectively.
There was a surge of investment stocks in 2004 (289 billion) before it continued to climb further and peaked at 311 billion in 2006. In contrast, only a small increase in money used to buy bonds was seen in 2004 (162 billion). The flow of funds to bonds then grew to 179 billion in 2005 before peaking at 188 billion in the last year of the period.
To sum up, stocks have been the most popular investment from 2001 to 2006.
This response includes a complete description of the amounts invested in stocks and bonds, as well as the comparison of their trends. The report is easy to follow and cohesion is well-maintained. The writer uses complex sentence structures and good range of vocabulary. The occasional errors in word choice don’t affect communication. Overall, this report seems worthy of Band 8.
Click here to see more IELTS reports of band 8


Want more task 1 practice test with diagrams