Skip to content

IELTS Reports- Band 8

IELTS Writing – samples of IELTS reports of Band 8

IELTS Report, topic: Bar charts describing the hours worked by men and women in 3 countries

This is a model answer for an Academic Writing Task 1 from the IELTS exam in the USA, shared recently. This response is likely to get Band 8 or 8.5 in IELTS.

You should spend about 20 minutes on this task

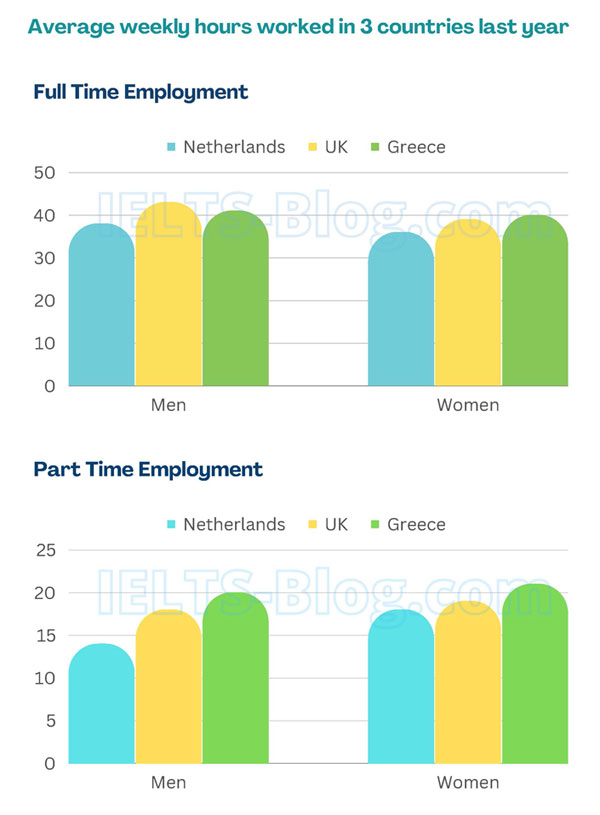
The charts below show the average hours worked last year by full time and part time employees in 3 countries. Summarise the information by selecting and reporting the main features, and make comparisons where relevant.

Write at least 150 words

IELTS Writing Task 1 Bar Charts of Hours Worked By Men and Women in 3 Countries

Band 8.5 Model Answer

The bar charts show the average number of hours that full-time and part-time employees worked in the Netherlands, the UK and Greece in the previous year.

Overall, what immediately stands out is the fact that the number of hours worked by male and female workers was relatively equal for both types of work, and that full-time employees worked almost twice as much as part-time employees.

Taking a closer look at the numbers for full-time positions, the figures for both men and women ranged between 35 to 40 hours per week. Male workers in the UK were the only ones to exceed 40 hours a week. The figures for the Netherlands were the lowest for both genders, at around 35 hours weekly.

Moving on to part-time employment, the difference between the number of hours worked by men and women is more apparent in this chart. People from the Netherlands worked the fewest hours with men spending 10 hours, and women – roughly 15 hours per week at work. The UK had almost equal figures for both genders, around 17 hours a week, while the figures for Greece were slightly higher; the male workers there did around 20 hours per week and female – a touch above 20.

Click here to see more IELTS reports of band 8

IELTS Report, topic: Bar chart describing the spending on R&D in 5 countries between 2001 and 2011

This is a model answer for an Academic Writing Task 1 from the IELTS exam in Iran, shared recently. This response is likely to get Band 8 or 8.5 in IELTS.

You should spend about 20 minutes on this task

The bar chart below describes the gross domestic spending on Research and Development in five countries between 2001 and 2011. Summarise the information by selecting and reporting the main features, and make comparisons where relevant.

Write at least 150 words

IELTS Writing Task 1 Bar Chart of spending on Research and Development in five countries between 2001 and 2011

Band 8.5 Model Answer

The bar chart describes the gross domestic expenditure on research and development by China, France, Spain, the UK and the USA during the years 2001, 2005 and 2011.

Overall, it can be seen that there was a general upward trend in the spending of all of 5 countries, albeit to varying degrees.

The USA spent the most on R&D in all three years, with the annual expenditure slightly increasing from 2.5% in 2001 to 2.8% of the country’s GDP in 2011. On the other end of the spectrum, Spain spent the least, starting at just below 1% in 2001 and finishing at around 2.3%.

China’s spending grew more than that of other countries, about 0.5% each year, and increased from about 0.9% in 2001 to around 2.8% in 2011. The remaining two countries, France and the UK, showed a similar pattern and their spending held relatively steady throughout the decade, at around 2% and 1.5% of GDP, respectively.

Click here to see more IELTS reports of band 8