Skip to content

IELTS Reports- Band 8

IELTS Writing – samples of IELTS reports of Band 8

IELTS Report, topic: Line graph describing production of 3 different fuels in the UK

IELTS Academic Writing Task 1 Line Graph Model Answer Band 8

This is a model answer for an Academic Writing Task 1 from the IELTS exam in Pakistan, shared recently. This response is likely to get Band 8 or 8.5 in IELTS.

You should spend about 20 minutes on this task

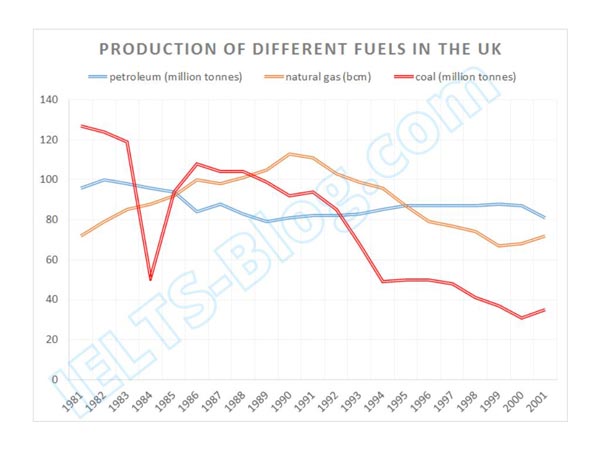
The line graph below describes production of different fuels in the UK from 1981 to 2000. Summarise the information by selecting and reporting the main features, and make comparisons where relevant.

Write at least 150 words

IELTS Writing Task 1 Line Graph Different Fuels Production in UK

* Note: this isn’t the actual graph given in the test, it was recreated for the purpose of demonstration.

Band 8.5 Model Answer

The line graph gives information about the production of coal, gas and petroleum in the UK from 1981 to 2001.

It is clear from the graph that there was a decline in the production of all three types of fuel over the given time period, especially coal.

To begin, coal started out with the highest value of 127 million tonnes produced in 1981, and then plummeted to 51 million tonnes in 1984. Thereafter, the ratio recovered significantly to 106 million tonnes in 1986. From then onwards, the ratio has been consistently declining and eventually reached a low of 35 million tonnes in 2001.

The production of petroleum showed a slight increase from 96 to 100 million tonnes at the very start of the period. From 1983, there was a gradual decrease in production to a low of 79 million tonnes in 1989. Later on, from 1991 to 2001 the numbers remained relatively stable, between 80 to 87 million tonnes.

Natural gas production started at 72 bcm and increased for almost 10 years, reaching the high of 113 bcm in 1990. That point marked a start of gradual decline of around 5 bcm per year, to the low of 67 in 1999. Thereafter, there was a slight recovery to 72 bcm in 2001.

Click here to see more IELTS reports of band 8

IELTS Report, topic: Table describing the use of water in 6 countries

IELTS Academic Writing Task 1 Table Model Answer Band 8

This is a model answer for an Academic Writing Task 1 from the IELTS exam in Sri Lanka, shared recently. This response is likely to get Band 8 or 8.5 in IELTS.

You should spend about 20 minutes on this task

The table below describes water usage for 3 different purposes in 6 countries in 2003. Summarise the information by selecting and reporting the main features, and make comparisons where relevant.

Write at least 150 words

IELTS Writing Task 1 Table Water Usage for Domestic Agricultural and Industrial Purposes In 6 Countries In 2003

* Note: this isn’t the actual table given in the test, it was recreated for the purpose of demonstration.

Band 8.5 Model Answer

The table illustrates the proportions of water use for 3 different purposes in 6 countries in 2003.

It is clear from the table that most countries used the largest share of water in the agricultural sector and the smallest – in industrial.

To begin, the United Kingdom and China had almost identical water usage profiles and their ratios of agricultural water usage were around 90%, while their domestic and industrial water usage ranged between 5 and 7%. India had slightly different figures, with a lower value for agriculture at 82% and higher figures for domestic and industrial usage at 10 and 8%, respectively.

Canada and Australia had a similar domestic water usage, at 63 and 65%, respectively; however the industry in Canada was a major water consumer at 32%, compared to just 2% in Australia. The Canadian agriculture consumed an insignificant 5% of water, unlike Australia, whose agriculture used 33% of water.

Lastly, Japan use the largest share of its water in agriculture (66%), and the rest was shared between domestic and industrial use, in similar proportions of 19% and 15%, respectively.

Click here to see more IELTS reports of band 8