IELTS Report, topic: Bar chart of average house prices
You should spend about 20 minutes on this task.
The chart below shows information about average house prices in five different cities between 1990 and 2002 compared with average house prices in 1989.
Summarise the information by selecting and reporting the main features and make comparisons where relevant.
Write at least 150 words.

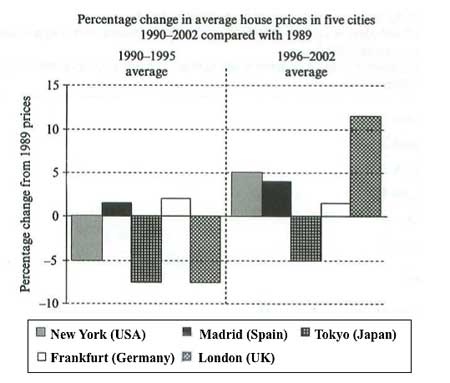
The illustrates the figures of average house prices in the five different cities during the period from 1990 to 2002, in comparison with the data in 1989. Overall, there was an upward trend in the percentage of change of house prices during the period shown in almost all of the cities except for Frankfurt.
As can be clearly seen, there was a considerable fall by approximately 5% in the proportion change of estate prices in New York between 1990 and 1995. Likewise, Tokyo and London, which had the same figures, witnessed a dramatic decrease by about 7% over the same period. However, the figures for Madrid and Frankfurt were around 2% and 3%, respectively.
During the period from 1996 to 2002, the figure for London was the highest with more than 10% in the percentage of change of house prices. During the same period, the rates at which the house prices increased were about 5% in New York and 4% in Madrid. This rate in Frankfurt was 2%, lower than the first 5-year period. Finally, the percentage change in Tokyo fell by around 5% between 1996 and 2002.
All the requirements of the task were covered fairly well. The key features were identified, emphasized and illustrated in a suitable and logical way. The ideas are presented in a logical order. All aspects of cohesion are taken care of well. The paragraphing is handled suitably and appropriately. The range of vocabulary allows the writer to communicate the exact meanings. Some sophisticated words/expressions are used in a clever way, with only occasional errors in word choice/expression choice. A wide range of grammatical structures are used. Most sentences are free of errors. Inappropriate use of grammar is very infrequent. Overall this report seems worthy of IELTS Band 8.
Click here to see more IELTS reports of band 8