Skip to content

IELTS Reports- Band 8

IELTS Writing โ€“ samples of IELTS reports of Band 8

IELTS Sample Reports of Band 8

IELTS Academic Writing Task 1 Model Answers Band 8

Last updated: June 13, 2024

Here you can find IELTS Sample Reports of Band 8, written by students and graded by an IELTS teacher. Click on one of the task types below to jump to model reports of that type.

Maps / Plans
Bar Charts
Line Graphs
Pie Charts
Mixed Pie Charts + Bar Graphs
Tables

Note: the topic of each report appears when you hold the mouse over the link. Every report is checked, marked, has comments and suggestions. Hold the mouse over to see suggested corrections. The teacher’s summary is at the bottom of each report.

IELTS Model Reports Describing Maps / Plans

IELTS Maps / Plans – sample report 1

IELTS Maps / Plans – sample report 2

IELTS Maps / Plans – sample report 3

IELTS Maps / Plans – sample report 4

IELTS Maps / Plans – sample report 5

IELTS Maps / Plans – sample report 6

IELTS Maps / Plans – sample report 7

IELTS Model Reports Describing Bar Charts

IELTS Bar Charts – sample report 1

IELTS Bar Charts – sample report 2

IELTS Bar Charts – sample report 3

IELTS Bar Charts – sample report 4

IELTS Bar Charts – sample report 5

IELTS Bar Charts – sample report 6

IELTS Bar Charts – sample report 7

IELTS Bar Charts – sample report 8

IELTS Model Reports Describing Line Graphs

IELTS Line Graphs – sample report 1

IELTS Line Graphs – sample report 2

IELTS Line Graphs – sample report 3

IELTS Line Graphs – sample report 4

IELTS Line Graphs – sample report 5

IELTS Model Reports Describing Pie Charts

IELTS Pie Charts – sample report 1

IELTS Pie Charts – sample report 2

IELTS Pie Charts – sample report 3

IELTS Model Reports Describing Mixed Graphs (Pie Charts And Bar Graphs)

IELTS Mixed Graphs – sample report 1

IELTS Mixed Graphs – sample report 2

IELTS Model Reports Describing Tables

IELTS Tables – sample report 1

IELTS Tables – sample report 2

IELTS Tables – sample report 3

IELTS Tables – sample report 4

IELTS Tables – sample report 5

Note: the reports are checked by an IELTS teacher, not an IELTS examiner or examiner trainer. All the bands are approximate.

suggested corrections are in the window

IELTS Report, topic: Line graphs describing the production and demand for steel in the UK

IELTS Academic Writing Task 1 Line Graph of Production and Demand for Steel in the UK

This is a model answer for an Academic Writing Task 1 from the IELTS exam in Italy. This response is likely to get Band 8 or 8.5 in IELTS.

You should spend about 20 minutes on this task

The line graphs below show the production and demand for steel in million tonnes and the number of workers employed in the steel industry in the UK in 2010. Summarise the information by selecting and reporting the main features, and make comparisons where relevant.

Write at least 150 words

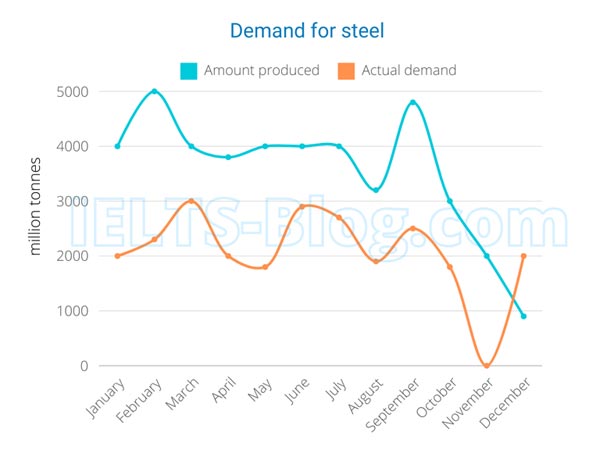
IELTS writing task 1 demand for steel

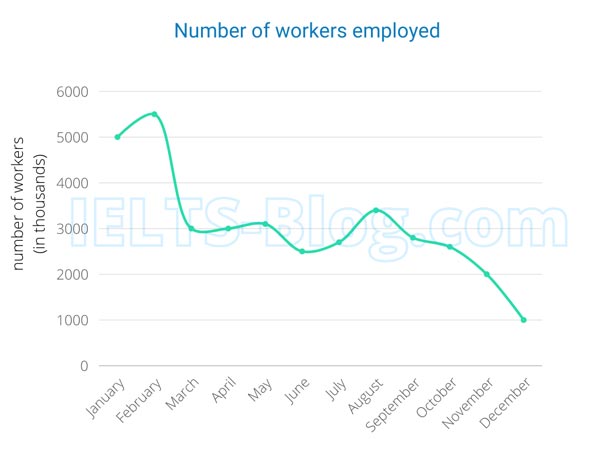
IELTS writing task 1 workers employed in steel production

* Note: these aren’t the original graphs given in the test, they were recreated for the purpose of demonstration.

Band 8 Model Answer

Download the Sample Band 8 Report here

The graphs illustrate the production and demand for steel in million tonnes, along with the number of workers employed in the UK steel industry in 2010.

Overall, steel production consistently exceeded actual demand across the year, with significant fluctuations observed in both metrics. Employment numbers also varied widely, showing a general decline over the twelve-month period.

Steel production peaked at 5000 million tonnes in February but dropped dramatically to just 900 million tonnes by December. Meanwhile, demand was highest in March and June, at 3000 million tonnes, but later dropped to zero in November. Despite these variations, production levels remained relatively stable from January to June, averaging around 4000 million tonnes. The latter half of the year saw more volatility, with production dropping sharply towards the end of the year. Notably, December was the only month in which the amount of steel produced was lower than the demand at 900 and 2000 million tonnes respectively.

Regarding employment figures, the number of workers started high in January at 5000 but saw a significant decline over the year, reaching the lowest point of 1000 in December. February had the highest employment at 5500 workers, which then steadily decreased. The workforce fluctuated slightly in the summer months at between 2500 and 3500 but continued to decline overall, dropping to the lowest number of just 1000 in December.

Click here to see more IELTS reports of band 8