Skip to content

Simone Braverman

Simone Braverman is the founder of IELTS-Blog.com and the author of several renowned IELTS preparation books, including Ace the IELTS, Target Band 7, the High Scorer's Choice practice test series, and IELTS Success Formula. Since 2005, Simone has been committed to making IELTS preparation accessible and effective through her books and online resources. Her work has helped 100,000's of students worldwide achieve their target scores and live their dream lives. When Simone isn't working on her next IELTS book, video lesson, or coaching, she enjoys playing the guitar or rollerblading.

IELTS Results competition winners in June 2021

Tom Peters once said, “Celebrate what you want to see more of”, and we want to see more test takers get great scores in IELTS – so today we are celebrating 6 very proud owners of some great IELTS results.

Their experience proves that Band 8.5 in IELTS is possible and Band 7.5 is within your reach. Some of them even got perfect 9’s in Listening and Reading, and that, by all means, is no easy feat!

Let’s give a round of applause to…

Academic Module – 1st placeBand 9 in IELTS

  • Nader Arvand from Iran, Band 8.5

Academic Module – 2nd place

  • Sara Shaimerdenova from Kazakhstan, Band 8

Academic Module – 3rd place

  • Chien-Yu Yeh from Taiwan, Band 7.5
  • Saleemuddin Mohammad from India, Band 7.5
  • Pichaya Amornrak from Thailand, Band 7.5

General Training Module – 1st place

  • Olga Ishutina from Russia, Band 8

Congratulations! Head over to our Instagram where we celebrate six success stories, and show them your appreciation! Winners will also receive their special certificates of achievement via email, and winning IELTS results will be displayed in the IELTS-Blog hall of fame – so if you won, please feel free to show them off to your friends!

How did they score so well?

We would LOVE to find out! We do know that Olga, Chien-Yu and Pichaya used our Writing Correction service to improve their writing. Sara used our Speaking Evaluation service and practice tests. To get as much info as possible, we contacted all the winners and hopefully they will be able to share their best exam tips with everyone. Learning from their experience would be an amazing opportunity, because this is one of the rare shortcuts available to you.

If YOU got a high score in IELTS, no matter when – this month, last month, a few months ago – we want to hear from you! We would like to extend our warm invitation to everyone who is happy with their IELTS score. Take part in our IELTS results competition today, and share your IELTS tips when you win!


Learn how to enroll here.

IELTS Report, topic: Bar chart and pie chart describing Australian water consumption (from IELTS High Scorer’s Choice series, Academic Set 1)

This is a model response to a Writing Task 1 topic from High Scorer’s Choice IELTS Practice Tests book series (reprinted with permission). This answer is close to IELTS Band 9.

Set 1 Academic book, Practice Test 4

Writing Task 1

You should spend about 20 minutes on this task.

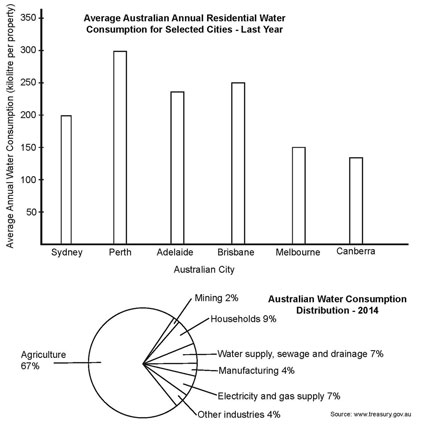
The bar chart below shows the average Australian water consumption in selected cities for last year. The pie chart shows the distribution of Australian water consumption for last year.


Summarise the information by selecting and reporting the main features, and make comparisons where relevant.

You should write at least 150 words.

Bar chart and pie chart describing Australian water consumption (from IELTS High Scorer's Choice series, Academic Set 1 book)

Sample Band 9 Report

The bar chart shows the average Australian water consumption in selected cities for last year, while the pie chart shows how water was used in Australia for last year.

It can clearly be seen that water supply affected most of the key parts of Australian life and industry, but the most severely affected sector in a shortage would be agriculture.

The highest water consumer was the city of Perth with 300 kilolitres per property as an annual average. It was followed by Brisbane and Adelaide, where properties used 250 and about 240 kilolitres a year on average. In Sydney households consumed 200 kilolitres of water annually, and the smallest yearly average consumption was recorded in Melbourne and Canberra, about 150 and 140 kilolitres per property respectively.

Among industries, the largest water user in Australia last year was agriculture, which took up over two thirds of usage at 67%. The next largest usage was by households (9%), water supply, sewage and drainage (7%) and water used for electricity and gas supply (7%). The rest was used by manufacturing (4%), other industries (4%) and mining (2%).

Go here for more IELTS Band 9 Reports