Skip to content

2022

IELTS Results competition winners in March 2022

Nelson Mandela famously said, “It always seems impossible until it’s done”, and if you’re wondering what his words have to do with this blog post, keep reading 🙂

Does Band 9 in any of the IELTS skills seem impossible? It’s not – in fact, six out of eight winners whom we are about to introduce got Band 9 in either Reading or Listening – or both!

Let’s put our hands together for…

IELTS results competition winners of March 2022

Academic Module

  • 1st place – Shokhrukhmirzo Jumanyazov from Uzbekistan, Band 8.5
  • 1st place – Nomathamsanqa Mthombeni from Zimbabve, Band 8.5
  • 2nd place – Dmitrii Kiselev from the Russian Federation, Band 8
  • 2nd place – Reza Zaeri from Iran, Band 8
  • 2nd place – Ahamed Imthikab Ahamed Ilyas from Sri Lanka, Band 8
  • 3rd place – Nalisha Shrestha from Nepal, Band 7

General Training Module

  • 1st place – Sahid Sarkar from India, Band 7.5
  • 2nd place – Prakash Bhagwan Sharma from India, Band 6.5

Congratulations to the winners! To mark this happy occasion we are sending certificates of achievement to the winners’ email addresses. Winning IELTS results will also be displayed in the IELTS-Blog hall of fame – so if you won, please feel free to show them off to your friends!

How did they score so well?

We’re always trying to find out from the winners how they did it. It’s great to see our students winning! Reza Zaeri (Band 8) used our writing correction service to find out how to increase his score. Dmitrii Kiselev (Band 8) relied on our book Target Band 7 to learn important IELTS techniques and then used several ‘High Scorer’s Choice’ practice tests to apply those techniques and master the skills he learned. Being able to contribute to their success feels amazing!

As for the other winners – we would love to hear from you, because when you share your stories and tell us how you studied, you are helping thousands of test takers, preparing for their exams right now. Any useful tips will be posted on IELTS-Blog.com, so everyone can use the same technique and get a better score in their own exam this month.

Did you know? IELTS results competition runs every month, and everyone is welcome to participate. Learn how to enroll here.

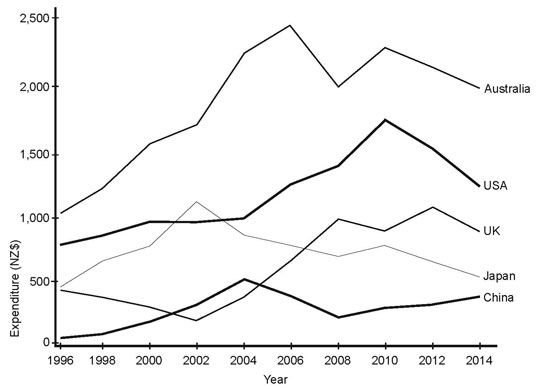
IELTS Report, topic: Five line graphs showing the annual visitor spend in New Zealand (from IELTS High Scorer’s Choice series, Academic Set 3)

This is a model response to a Writing Task 1 topic from High Scorer’s Choice IELTS Practice Tests book series (reprinted with permission). This answer is close to IELTS Band 9.

Set 3 Academic book, Practice Test 13

Writing Task 1

You should spend about 20 minutes on this task.

The graph below shows the annual visitor spend for visitors to New Zealand from 5 countries for the years 1996 to 2014.

Summarise the information by selecting and reporting the main features, and make comparisons where relevant.

You should write at least 150 words.

5 line graphs showing annual visitor spend in New Zealand (from IELTS High Scorer's Choice series, Academic Set 3 book)

Sample Band 9 Report

The graph shows the amount of money tourists from five different countries spent while visiting New Zealand between the years 1996 and 2014. The five countries compared are Australia, the USA, the UK, Japan and China.

It is clear that the amount of money spent in New Zealand by tourists from almost all the named countries increased from 1996 to 2014, although there were some fluctuations along the way.

In 1996, Australian citizens spent the most, at NZ$1,000 per person, followed by tourists from the USA, Japan, the UK and, finally, China at NZ$100 per visitor. Most countries experienced growth in visitor spend during the 18-year period that peaked at various points in time for different countries, and then declined. Australia’s spending, for instance, peaked at NZ$2,500 in 2006, whereas the USA reached a top of NZ$1,700 in 2010. China’s peak in 2004 was the lowest of all the countries (NZ$500).

In spite of the decline in spending that the countries experienced, overall, tourists were spending more at the end of the period compared to the beginning. In 2014, Australia’s visitors spent the most at NZ$2,000, followed by tourists from the USA, UK, Japan and China, at NZ$400 per person. The only country whose citizens spent the same amount in 1996 and 2014 was Japan (about NZ$500 per person).

Go here for more IELTS Band 9 Reports