Skip to content

2018

IELTS Report, topic: Pie chart and bar graph describing employment percentages (from Target Band 7 book)

This report was written on a topic from “Target Band 7” book (page 43, reprinted with permission).

You should spend about 20 minutes on this task

The diagrams below contain information regarding percentages of people occupied in various types of position in 1998 and 2001.

Write a report for a university tutor describing the information shown.

Write at least 150 words

Pie chart describing percentages of workers in different positions from Target Band 7 book
Bar graph describing percentages of workers in different positions from Target Band 7 book

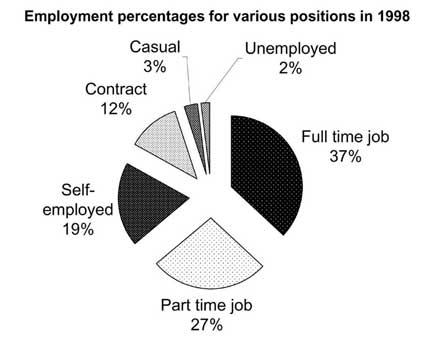
The two charts describe the number of people in various types of employment (casual, unemployed, full time job, part-time job, self-employed and contract) in 1998 and 2001. It is clear that the majority of people held a full time position in both 1998 and 2001.

In 1998 full time workers were the largest group (at 37%), followed by people working part-time jobs (27%), self-employed (19%) and contract workers (12%). Casual labourers and the unemployed made up only 3% and 2% of the workforce, respectively.

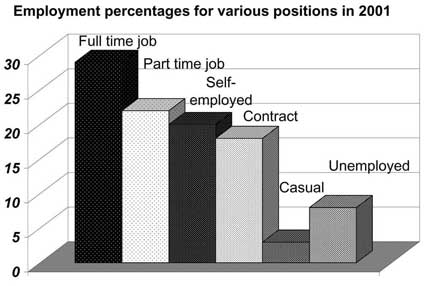
In 2001, although full time position holders were still the majority, their proportion dropped to 28% and that of part-time workers – to 20%. The proportion of self-employed remained at 19%, but the number of contract workers’ noticeably increased to 18%. Another significant increase was in the proportion of unemployed, which grew more than threefold to 7% in 2001. Casual workers’ share seemed to stay unchanged at 3%, making them the smallest group in the workforce.

Overall, the charts demonstrate a trend of people leaving full-time employment and the growing unemployment.

Click here to see more IELTS reports of band 8

IELTS test in Nepal – December 2018 (Academic Module)

Our friend V took the IELTS test in Nepal and remembered the following Writing and Speaking questions:

Writing testIELTS test in Nepal

Writing task 1 (a report)

We were given a diagram of the new planned structure in a town. We had to summarize and explain it.

Writing task 2 (an essay)

Scientists agree that many people eat too much junk food and it is damaging their health. Some people think that this problem can be solved by educating people, while others believe that education will not work. Discuss both views and give your own opinion.

Speaking test

Interview

– What is your full name?
– Can I see your ID?
– Where are you from?
– Do you work or study?
– What subject are you studying?
– Why did you choose it?
– Can you describe your home?
– Which room do you like the most?
– Do you have plants at home?
– Did you ever plant any kind of plants?
– Would you appreciate if someone gifted you a plant?
– Do you have savings?
– Did you give money as a gift to children?
– What is your opinion about giving pocket money to children?
– Did your parents give you money for doing household work?

Cue Card

Describe a place you have visited and you traveled by public transport. Please say

– What and where is this place?
– Who did you go there with?
– Did you like the experience?

Discussion

– How popular is public transport in your city?
– What are the advantages and disadvantages of using it?
– How can these problems be solved?